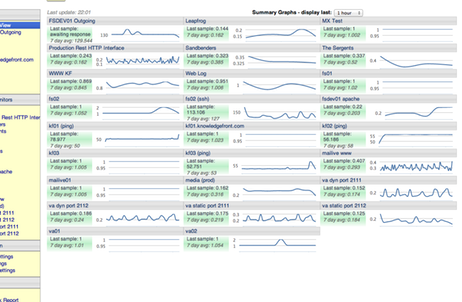
Dashboard
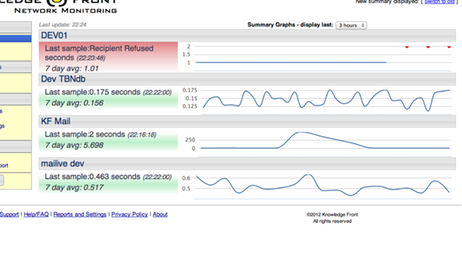
Easy to read at a glance. Red denotes a monitor that has triggered an alert. Green means all systems go.
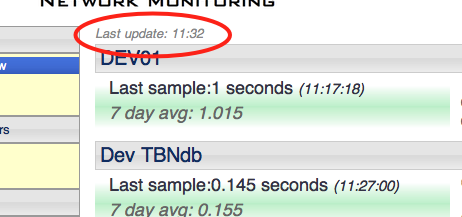
The most recent test as well as some historical performance data is also shown as well.
Using AJAX the Dashboard pulls new data automatically every 60 seconds.
As more monitors are added to the system the dashboard automatically compensates to show all information without scrolling. Additional columns are added and the overall size of each monitor may shrink to fit all the information on the screen.