Network Monitor Reports
The network reports display an overview of the completed tests and any alerting that has taken place, but also grants the ability to drill down to view individual data points.
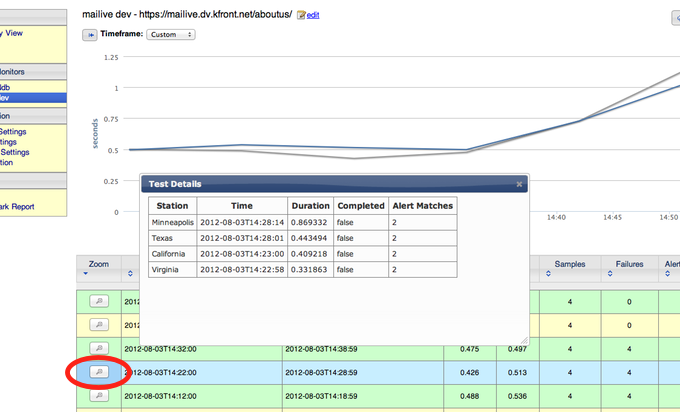
A standard report displays a rolled up view of the data from all monitoring stations during the given polling period as a single data point. Clicking the Zoom button as shown below will display a table with the individual tests displayed.
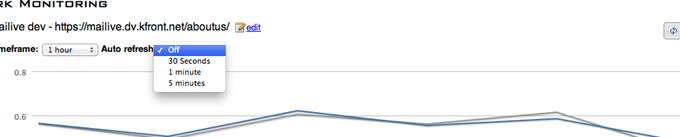
When troubleshooting issues or just keeping an eye on things it can be helpful to use the Auto Refresh feature in the report. Select the refresh rate (30 seconds to 3 minutes) and the report will fetch new data automatically
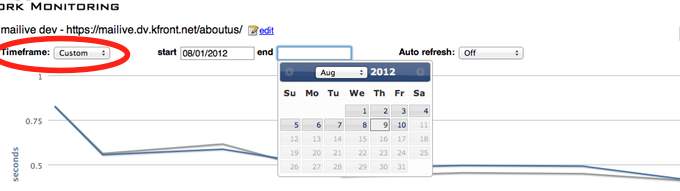
Quick selections are great for immediate issues, but what about viewing longer term trends? No problem. The last item of the Time frame select box is Custom which will display a date picker for selecting the date range.
In order to display large amounts of data the system calculates averages behind the scenes.
When viewing reports for 12 or more hours of data the system defaults to displaying hourly averages. Clicking the zoom button (as seen above) will display the details for the selected hour.
Viewing reports containing more than 7 days of data will cause the system to use the daily averages. Clicking on the zoom button in this case will display the hourly averages for that day.